
Data
Data Analysis
2022
Motor Trend Car Road Tests Project
Description
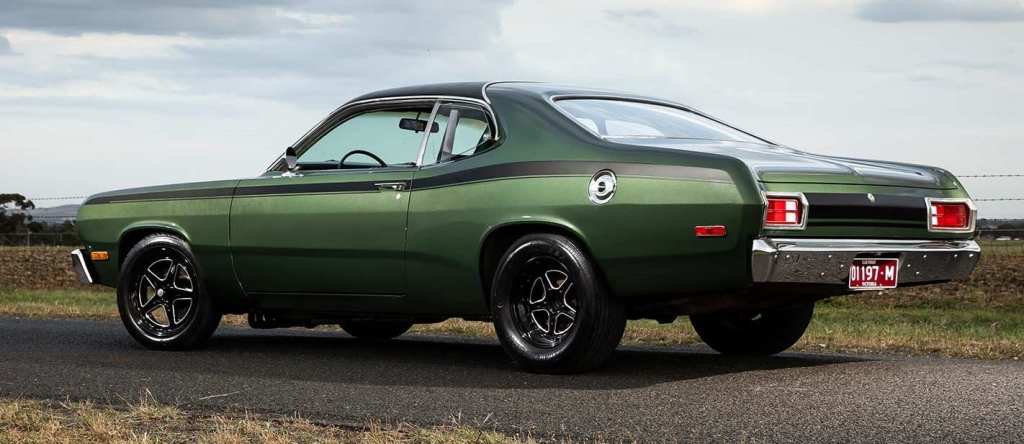
mtcars is an open-source dataset built-in R, the data was extracted from the 1974 Motor Trend US magazine, and comprises fuel consumption and 10 aspects of automobile design and performance for 32 automobiles (1973–74 models). This dataset is definitely one of my favorites to work with although it is unrealistic for data sets to be as clean as mtcars is with no missing values or errors. Nevertheless, digging deep into real historical data brings me great joy. The aim of the project was to highlight variables that to a higher degree affect fuel efficiency, starting with descriptive analytics (what happened?) and following up with diagnostic analytics (why did it happen?).

A description of the ten aspects in mtcars
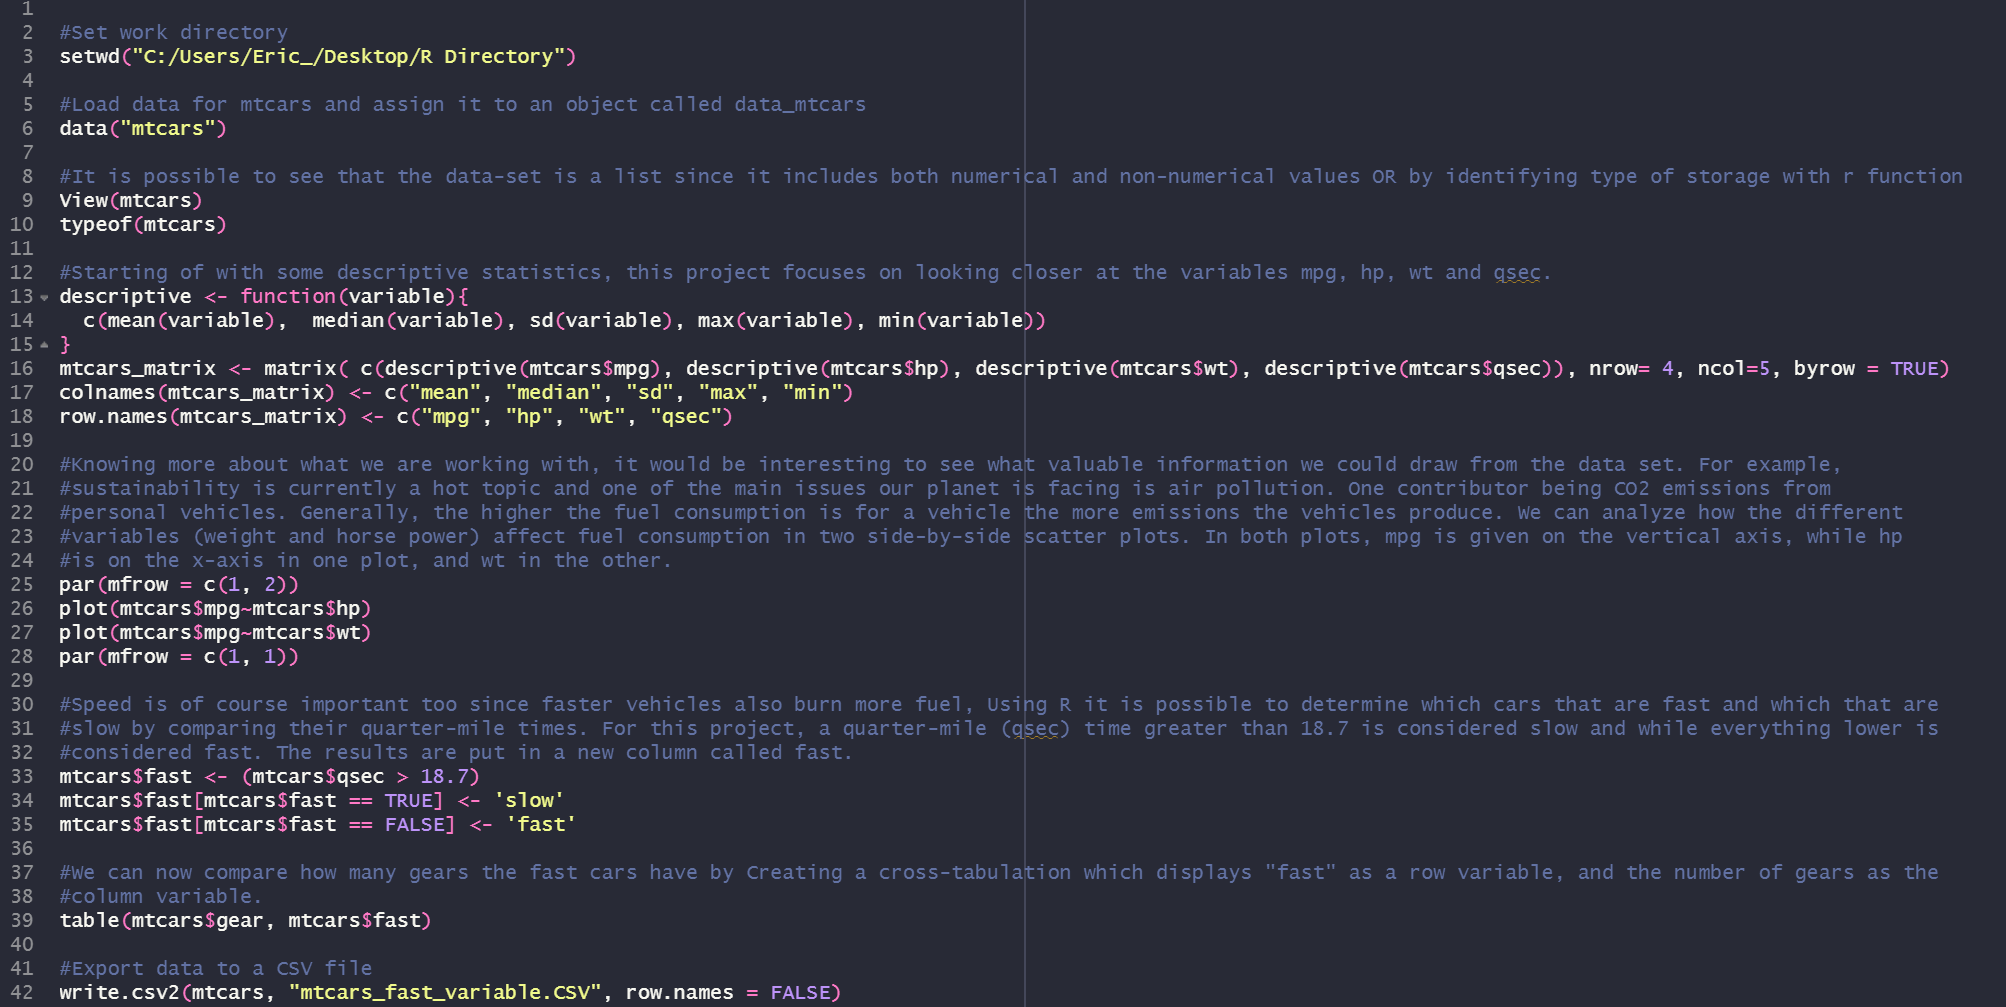
R Script
Descriptive Analytics (What happened?), few examples :
-mpg decreases as hp increases
-mpg also decreases as Wt increases
-The majority of fast cars have three gears
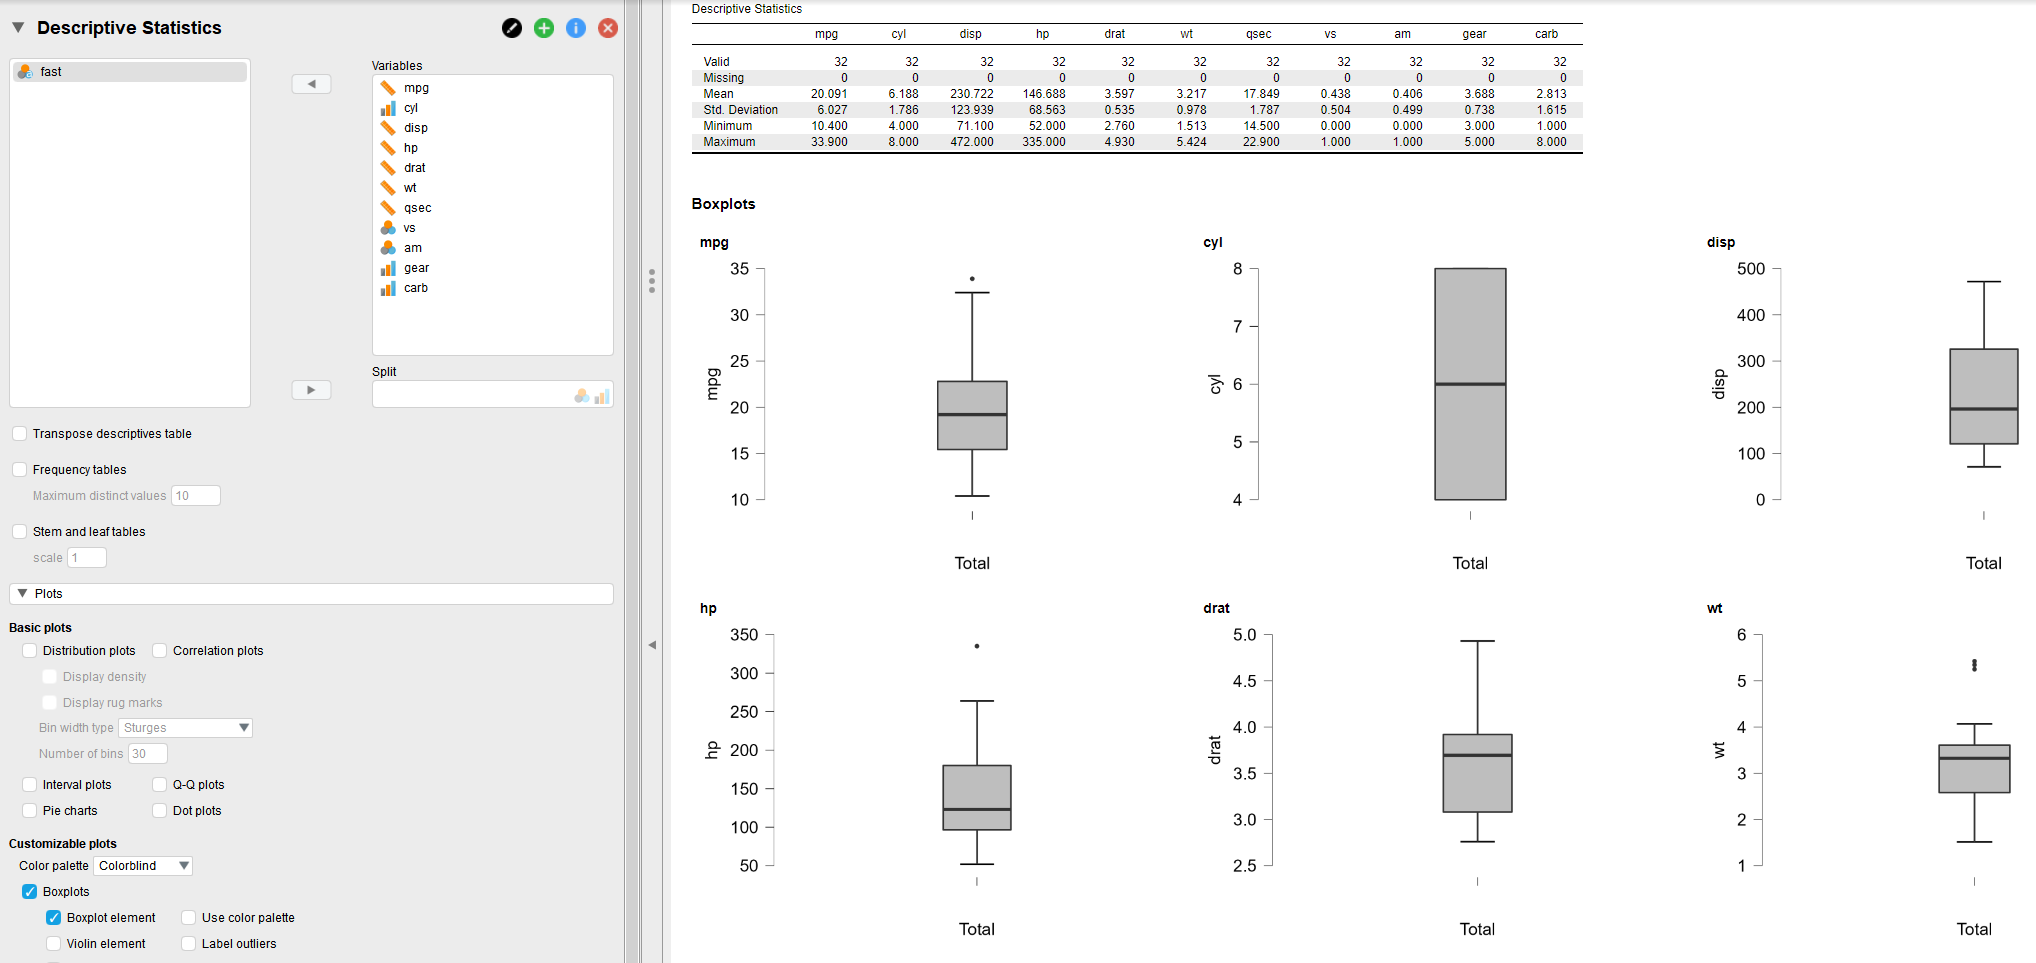
Descriptive statistics for the variables mpg, hp, Wt and qsec
Plots for mpg vs hp (Left) and mpg vs Wt (Right)
Number of gears for fast and slow cars respectively


But why did….
-mpg decrease as hp increased
-mpg decrease as weight increased
-The majority of fast cars have three gears, does the number of gears determine its speed?
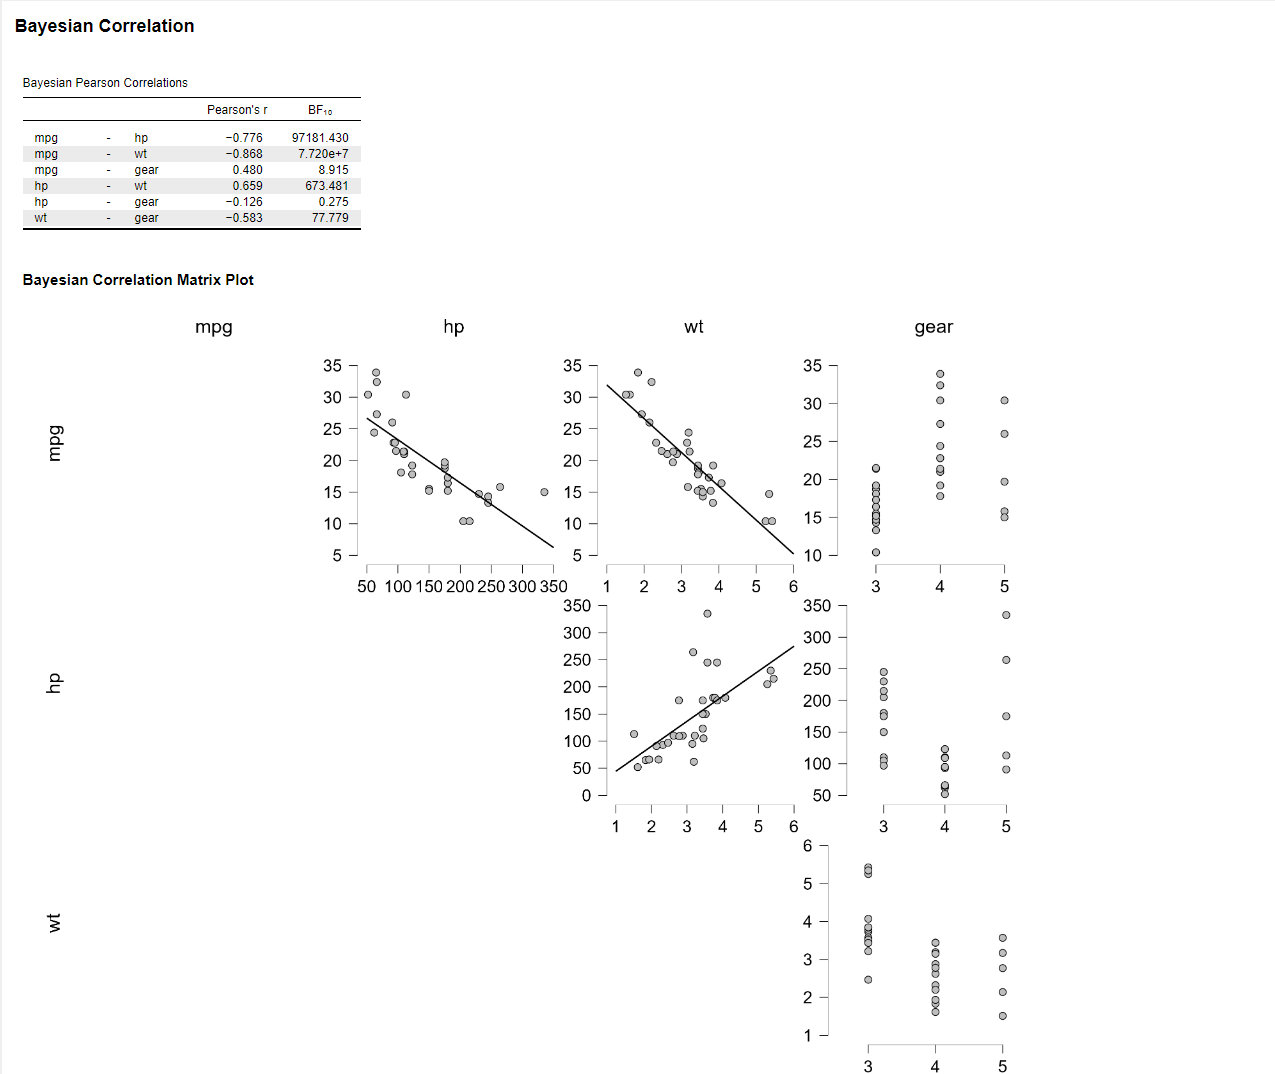
To find out we can use JASP to see how each variable correlates with eachother
A quick double-check with descriptive statistics illustrates that some values are outliers. It would of course been possible to make boxplots in R as well but with the GUI that JASP has the process is quicker, especially when there are several boxplots.
With the Bayesian Correlation we can see that there are multiple strong negative correlations between mpg and hp (-0.776) as well as Wt (-0.868). This means that mpg decreases as hp and Wt increase (see illustrations below) . However, the number of gears does not seem to have a strong correlation with mpg.
Data Analysis Summary
Descriptive (What?)
Fuel efficiency (mpg) differed between the cars:
-mpg decreases as hp increases
-mpg also decreases as Wt increases
Diagnostic (Why?)
mpg has a negative correlation with hp and Wt
mpg also has a weak correlation with gears, meaning there are other variables that affect mpg more
*Predective (Next?)
Pretending we now have the data from the previous four motor trend magazines, what trends/patterns can we see and what will happen next?
An example could be that we notice that there is a trend where American muscle cars are being installed with more powerful engines. Based on the data, we could then predict that these cars will need to refuel more often.
*-Hypothetical scenario
Data Visualization (Qlik)

Logistics and SCM
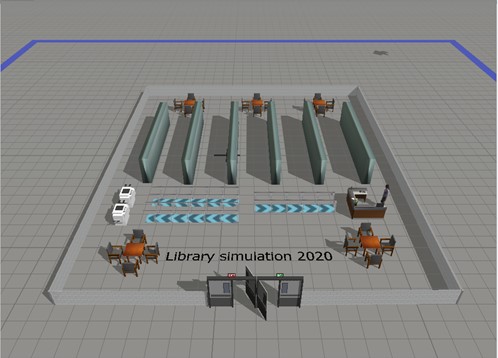
University Library Simulation
FlexSim is a simulation modeling and analysis software that allows the creator to model, simulate, analyze, and visualize (in 3D!) several different systems such as manufacturing, material handling, healthcare, warehousing, etc.
The project serves to complete following objectives:
- Answer the questions “what can libraries do to maximize throughput of loaners and minimize their staying time in queue?”
- How could libraries determine the optimum number of self-checkouts and service desks?
- Produce a model that could be used as a reference for improving similar activities.
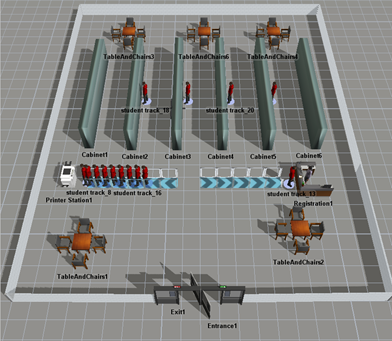
Create the Setup
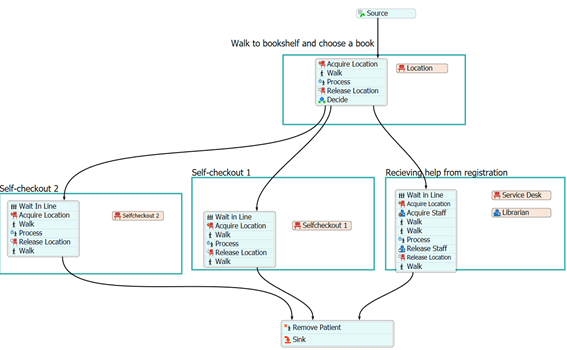
Restrictions (Left) and process model (Right)


The book-loaners, students and non-students, would arrive randomly (poisson distributed) during opening hours.
Results
Model 1 (Original layout): The first model included one self-checkout desk and one registration desk. The book loaner track (Process model 1) started with the loaner’s arrival, the book loaner then proceeded by walking to one or several of the bookshelfs to select a book , then they would make a choice to either move to the queue for self-checkout (borrow a book) or the queue for service (recieve assistans). After renting their book or recieving assistans each individual would walk to the exit and leave.
After testing several alternative models (extra self-checkouts, adding more librarians, increasing/decreasing cycle times) there seemed to be one feasible solution, Model 2

Model 2 (Solution): The second model included a second self-checkout desk to improve the throughput by decreasing lead times. Lead times were shortened since the staying time in queues was shorted. There was still one registration desk, however, no changes were made in this activity since the workload that was set seemed appropriate. The book loaner track (Process model 2) started with the loaner’s arrival, the book loaner then proceeded by walking to one or several of the bookshelves to select a book, then they would make a choice to either move to one of the queues for self-checkout (borrow a book) or the queue for service (receive assistants). After renting their book or receiving assistance each individual would walk to the exit and leave.

Evaluation
The simulation is not valid since it does not incorporate cost in the decision-making process and also because the data consisted of several assumptions rather than empirical data. However, this simplified simulation still provides an idea of how simulation process modeling can be done. Additionally, this project could also be used as a reference for improving similar activities, given that there is more accurate data available.
